Page guide
Signals
Where did something just change: the result, the long-run record, management's plans, ownership or the chart?
In 30 seconds
- 1Each row is a company with at least one live signal.
- 2Six menus pick signals: results, fundamentals, guidance, ownership, price, exit.
- 3Coloured tags under each row show which signals fired.
What you get here
Pick the kind of user you are. Yours is open.
I am
Not signed in
- Sign in to open this page.
A free account takes a minute: tap Sign in at the top and use your email or Google.
Step by step
- 1
Pick signals
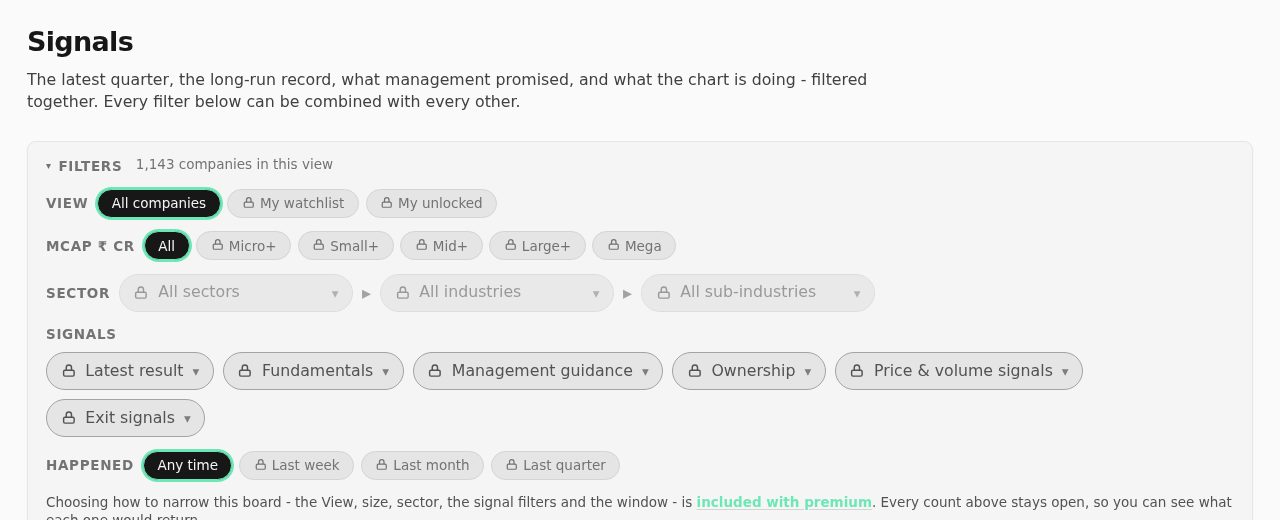
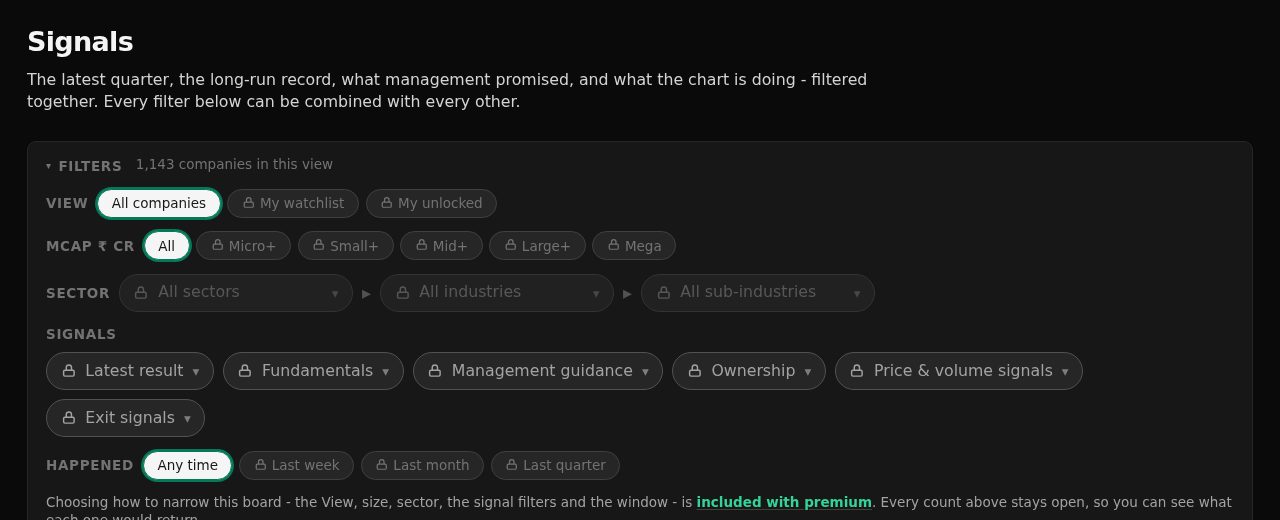
Each menu lists its signals with a live count of how many companies each would show. Filters combine: pick "ROCE above 20%" and "Stage-2 advance" to see only companies with both.
- 2
Narrow by time, size and sector
"Happened" limits price signals to the last week, month or quarter. "Mcap" and the sector menus narrow the list.
- 3
Read the table
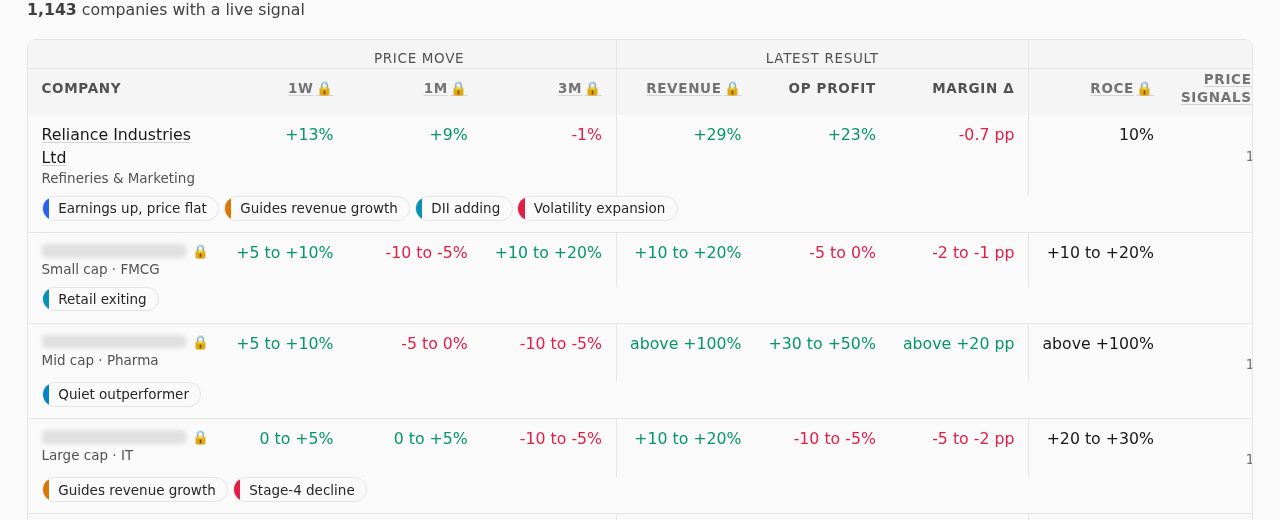
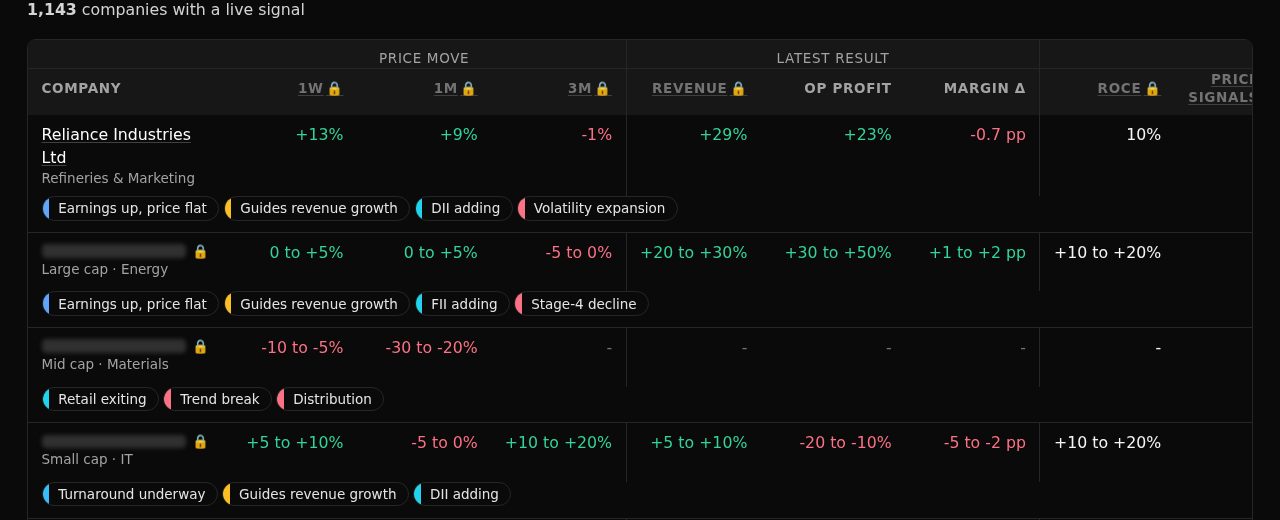
Price move over 1 week to 3 months, the latest result, ROCE, and how many price signals are live. The colour of a tag tells its family; the legend under the table explains them.
- 4
Watch for exit signals
"Exit signals" lists companies whose chart or earnings are weakening, such as "Trend break" or "Stage-4 decline".
Try this
Quality stocks in an uptrend (premium)
- Fundamentals: "ROCE above 20%".
- Price & volume: "Stage-2 advance".
What fired on my stocks this week (premium)
- "View": "My watchlist".
- "Happened": "Last week".
Words on this page
- Stage 2 / Stage 4
- Price above a rising long-term trend (healthy) / below a falling one (weak).
- Breakout on volume
- Price clears its recent range on more than twice the usual trading.
- Golden / death crossover
- The 50-day average price crosses above / below the 200-day average.
- Smart money
- Foreign and domestic institutions (FII and DII) together.
- Pledge
- Promoter shares given as security for a loan. Rising pledges are a risk.
More terms in the glossary.