Page guide
Sectors & industries
Which industries are getting better or worse, and which companies stand out in them?
In 30 seconds
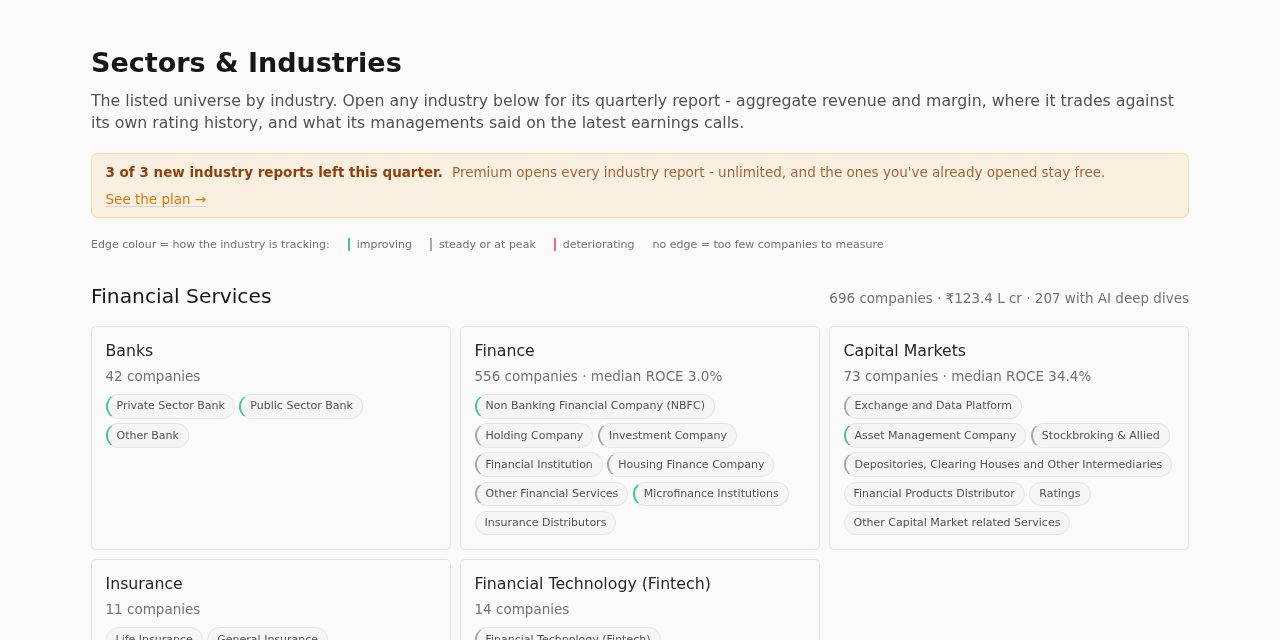
- 1The coloured edge on each card shows if the industry is improving or slipping.
- 2Click a sub-industry chip to open its quarterly report.
- 3A free account opens 3 full reports a quarter.
What you get here
Pick the kind of user you are. Yours is open.
I am
Not signed in
- The map, and each report's numbers and headline. The screen and earlier quarters are locked.
A free account takes a minute: tap Sign in at the top and use your email or Google.
Step by step
- 1
Scan the map
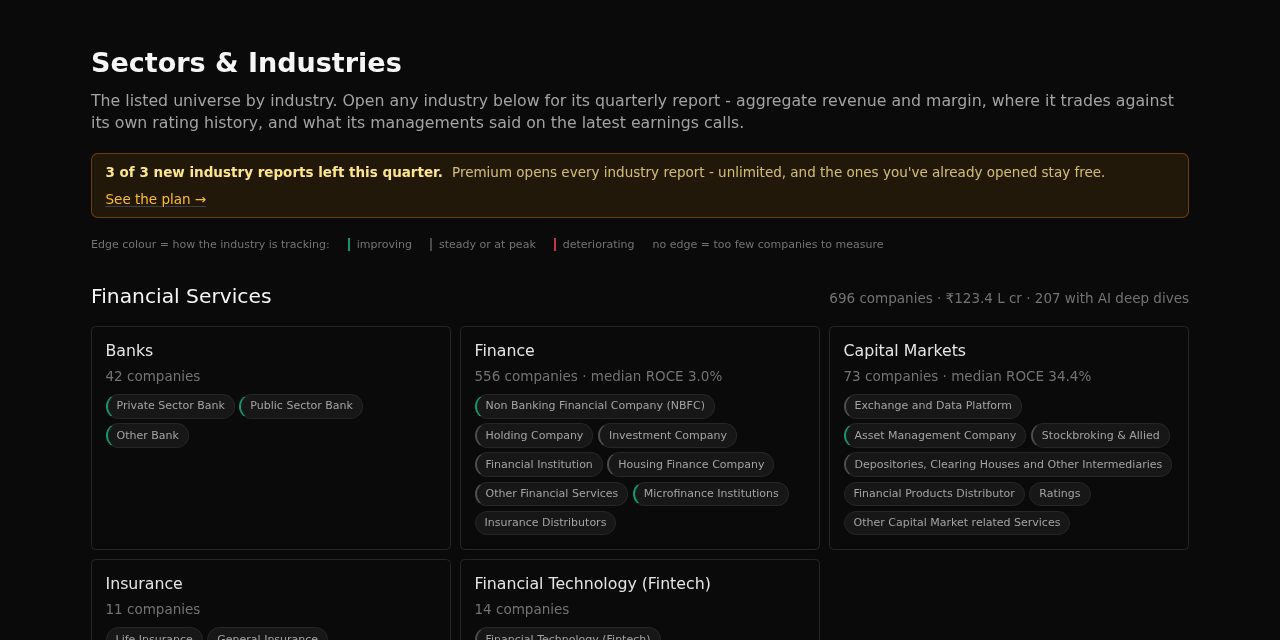
Industries are grouped by big sector, largest first. A green edge means improving, amber means steady or at a peak, red means getting worse.
- 2
Open an industry report
Click a chip. The report shows the quarter in numbers, how expensive the industry is against its own 5-year history, what managements said, and the outlook.
- 3
Use the screen
Exhibit 4, "Screen", lists companies cheaper than the industry, with better returns and at least 2 growth plans. It opens with a full report.
Try this
Find an improving industry
- Look for green-edged chips.
- Click one and read the headline and Exhibit 1.
Find ideas inside it
- Scroll to Exhibit 4, "Screen".
Words on this page
- Tailwind / headwind
- A theme helping / hurting the industry.
- Median ROCE
- The middle company's return on capital: a fair picture of the typical business.
More terms in the glossary.